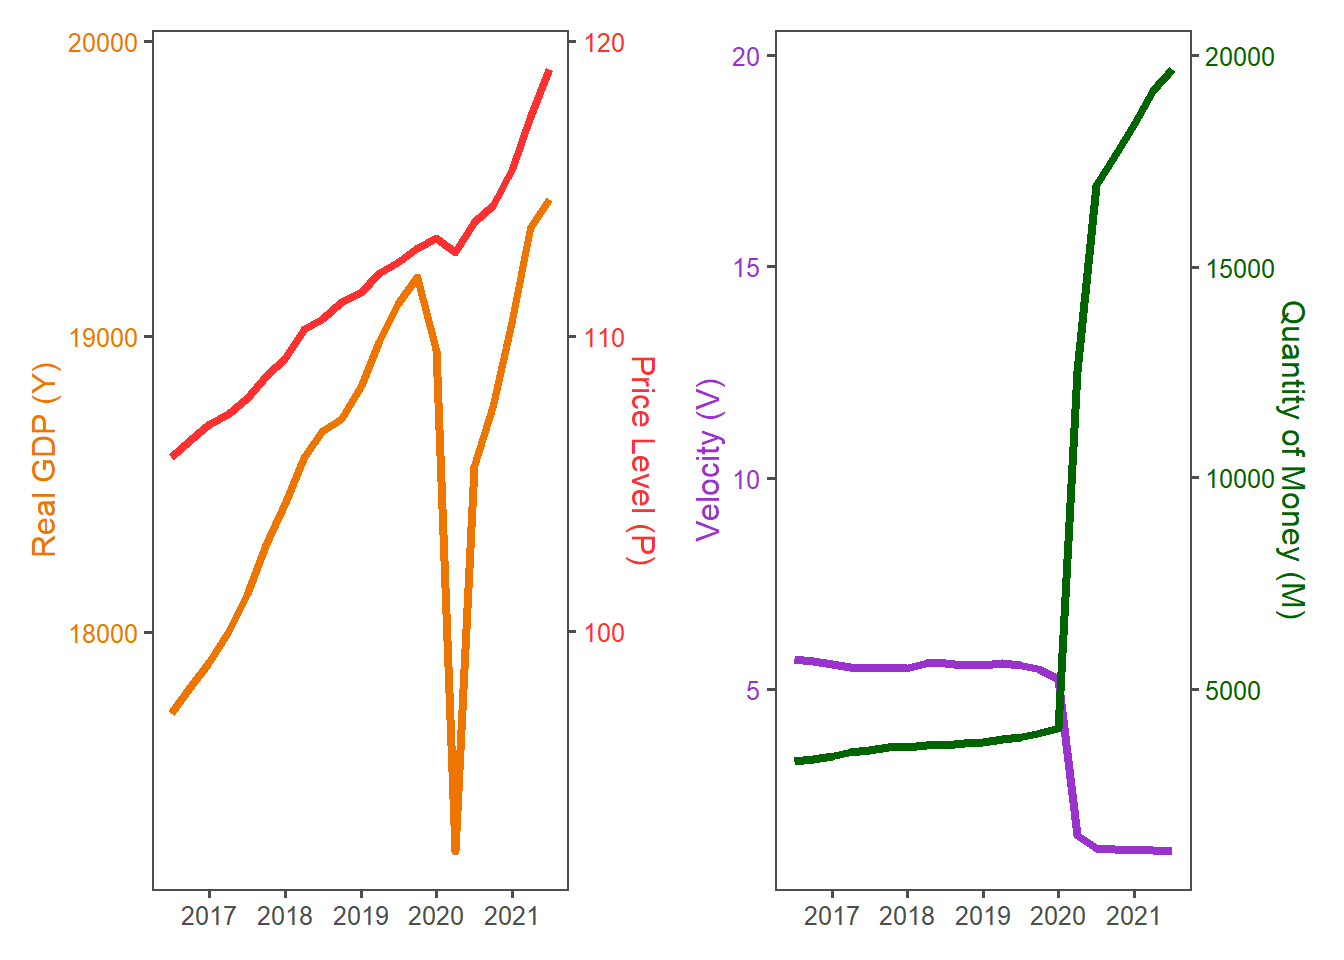
Velocity of money
The quantity equation is given by M * V = P * Y. My motivation here is: although recent CPI (inflation) numbers are higher (> 5.0%), they aren’t nearly as high as you might expect given the dramatic jump in the quantity of money (I’m just looking at M1 here). A common explanation I’ve read is the same that Cathie Wood recently gave (in tweet reply to Jack Dorsey now-infamous hyperinflation claim) here at her twitter account. She said “velocity is still falling.”
FRED key (private), echo=FALSE
library(fredr)
library(tidyverse)
library(patchwork)
library(ggthemes)

obs_start = as.Date("2016-07-01")
obs_end = as.Date("2021-04-01") # not used

Y_realGDP = "GDPC1"; P_deflator = "GDPDEF"
M_quantity = "M1NS"; V_velocity = "M1V"

fredr_set_key(davidh_key)

params <- list(
  series_id = c(Y_realGDP, P_deflator, M_quantity, V_velocity),
  frequency = "q"
)

t1 <- pmap_dfr(
  .l = params,
  .f = ~ fredr(series_id = .x, frequency = .y)
)

t2 <- t1 %>% pivot_wider(names_from = series_id) %>% select(!starts_with("realtime"))
t3 <- t2 %>% filter(date >= obs_start)

a1 = 8000; b1 = 100
sz_line = 1.5
clr_Y = "darkorange2"
clr_P = "firebrick1"
clr_M = "darkgreen"
clr_V = "darkorchid3"


p1 <- ggplot(t3, aes(x = date)) +
  geom_line(aes(y = GDPC1), size = sz_line, color = clr_Y) +
  geom_line(aes(y = GDPDEF * b1 + a1), size = sz_line, color = clr_P) +
  scale_y_continuous(
    name = "Real GDP (Y)",
    sec.axis = sec_axis(~ (. - a1)/b1, name = "Price Level (P)")
  ) +
  theme_few() +
  theme(
    axis.title.x = element_blank(),
    axis.title.y.left = element_text(color = clr_Y),
    axis.text.y.left = element_text(color = clr_Y),
    axis.title.y.right = element_text(color = clr_P),
    axis.text.y.right = element_text(color = clr_P)
  )

a2 = 0; b2 = 1/1000

p2 <- ggplot(t3, aes(x = date)) +
  geom_line(aes(y = M1V), size = sz_line, color = clr_V) +
  geom_line(aes(y = a2 + M1NS * b2), size = sz_line, color = clr_M) +
  scale_y_continuous(
    name = "Velocity (V)",
    sec.axis = sec_axis(~ (. - a2)/b2, name = "Quantity of Money (M)")
  ) +
  theme_few() +
  theme(
    axis.title.x = element_blank(),
    axis.title.y.left = element_text(color = clr_V),
    axis.text.y.left = element_text(color = clr_V),
    axis.title.y.right = element_text(color = clr_M),
    axis.text.y.right = element_text(color = clr_M)
  )

p1 + p2